5 + Best WordPress Data Visualization Plugins 2025

Do you want to showcase information in a visual chart on your site?
Data visualization is an essential tool for presenting complex data in an understandable and engaging format. With the abundance of data available on the internet, it’s crucial to have an efficient way of visualizing this information. WordPress provides numerous plugins that can help with data visualization, whether it’s displaying statistics, graphs, or interactive charts.
These plugins can be beneficial for a variety of users, including bloggers, business owners, and data analysts. They can help businesses make data-driven decisions by providing an easy way to visualize and analyze large amounts of information. Bloggers can use data visualization to create engaging content, such as infographics and interactive charts, that can attract more readers to their website.
There are various data visualization plugins available for WordPress, each with its own unique features and capabilities. Some plugins provide pre-designed templates for specific types of charts, while others offer more advanced customization options. With the right plugin, you can turn complex data into easy-to-understand visuals that can effectively communicate your message.
In this article, we’ll take a look at some of the best WordPress data visualization plugins on the market. Whether you’re a business owner looking to make data-driven decisions or a blogger trying to create engaging content, these plugins can help you display your data in a way that’s both informative and visually appealing. So, let’s dive in and explore the top data visualization plugins available for WordPress.
Let’s see them below:
Best WordPress Data Visualization Plugins 2025
Visualizer: Tables and Charts Manager for WordPress
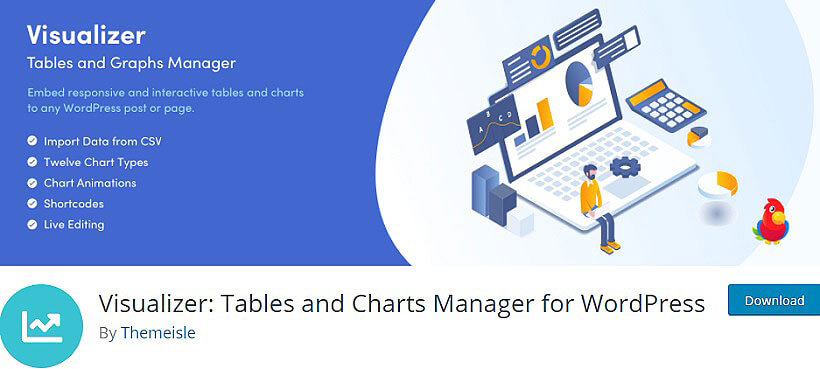
Visualizer is a powerful data visualization tool for WordPress. With its intuitive drag-and-drop interface, users can easily create custom tables, charts, and graphs from various data sources. It offers a wide range of customization options, including color schemes, fonts, and chart types. Visualizer supports popular data sources like Google Sheets, CSV files, and MySQL databases. Its user-friendly interface and rich features make it an excellent choice for businesses, bloggers, and data analysts who want to display data in a visually appealing and informative way.
Major Features:
- Responsive
- Gutenberg Support
- Flexible & Customizable
- 9 Chart Types
Infogram – Add charts, maps, and infographics

Infogram is a powerful WordPress plugin that enables users to easily create and add charts, maps, and infographics to their websites. With a simple drag-and-drop interface, you can customize your designs and choose from a wide range of templates and data visualization options. Infogram is a great tool for bloggers, journalists, marketers, and anyone looking to add engaging and informative visual content to their website. It integrates seamlessly with WordPress and can be used to create interactive reports, dashboards, and presentations. Try Infogram today and take your content to the next level.
Major Features:
- User-friendly
- Authenticate into their own library
- Supports one-click embedding
- Wide range of high-quality template designs
- Fast & Easy
Infographic Maker – iList
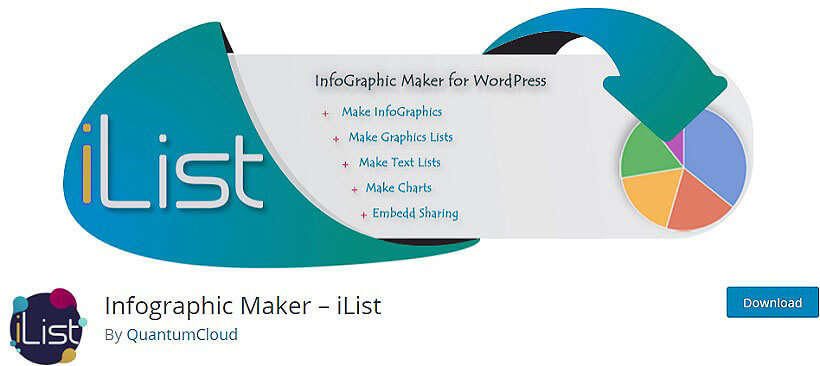
Infographic Maker – iList is a powerful plugin for WordPress that allows users to create interactive and customizable lists in a visually appealing way. With a variety of list styles, icons, and images to choose from, this plugin makes it easy to create engaging and informative lists that can be shared across social media and other platforms. Whether you’re looking to showcase your products or services, or simply share information in a fun and engaging way, Infographic Maker – iList is an excellent tool for any WordPress user.
Major Features:
- SEO friendly
- Responsive
- Infographics are embeddable
- Customizable for every aspect of colors and fonts
Stockdio Historical Chart

The Stockdio Historical Chart plugin is a powerful data visualization tool for WordPress. It allows users to create and embed interactive financial charts on their websites, displaying historical stock market data with customizable options. With its easy-to-use interface and advanced features, this plugin is ideal for anyone looking to display financial data in a clear and engaging way. Whether you’re a blogger, journalist, or financial professional, the Stockdio Historical Chart plugin is an essential tool for bringing financial data to life.
Major Features:
- Simple to Use
- Gutenberg editor friendly
- Attractive charts
- Responsive
iChart – Easy Charts and Graphs with COVID Widgets
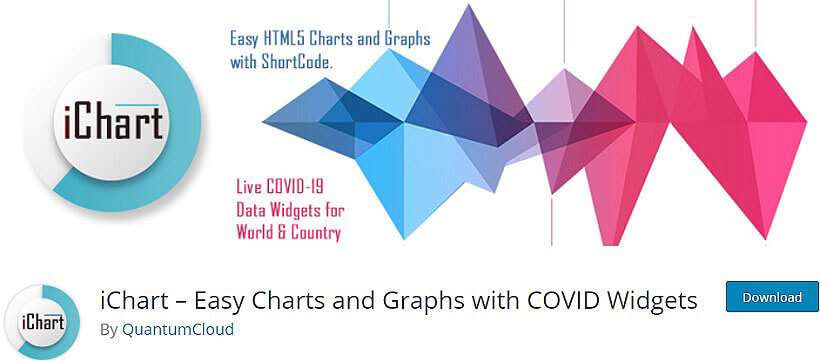
iChart is a WordPress plugin that lets you create beautiful charts and graphs with ease. With a wide variety of chart types available, you can create stunning visuals to display your data. It also offers COVID widgets to keep track of the latest COVID-19 statistics. iChart has a user-friendly interface that allows you to customize the charts to match your website’s branding. It’s perfect for bloggers, journalists, and businesses looking to showcase data in an engaging way.
Major Features:
- No Chart saving or data table option
- Quick Shortcode Generator for Charts
- HTML5, Responsive Charts
- Quick Shortcode Generator for Charts
- Supports Pie Charts, Bar charts, Line Charts, etc
Snowball

Snowball by openHTML is a powerful WordPress plugin that enables users to create beautiful and interactive charts and graphs for their websites. With easy-to-use features, this plugin allows you to customize colors, fonts, and styles, making it easy to match your brand’s aesthetic. The plugin supports a wide range of chart types, including line, bar, area, and pie charts. You can also use Snowball to add data tables and create infographics, making it a versatile tool for visualizing complex data.
Major Features:
- User-friendly
- Extremely Responsive
- Support different content including text, images, etc
- Customize a block with HTML & CSS
To Conclude,
These top WordPress data visualization plugins offer robust options for displaying data in an engaging and informative way. Whether you need charts, graphs, or infographics, there’s a plugin out there to meet your needs. From the easy-to-use iChart to the more advanced Visualizer: Tables and Charts Manager, these plugins will help you create stunning data visualizations that will impress your audience and make your website stand out. Choose the plugin that best suits your needs, and start creating amazing data visualizations today!
Please share your thoughts or suggestions regarding the article above and write them in the comment section below: